Motivation
Scientific AI and energy systems research increasingly require running experiments across a mix of local machines, Docker containers, and high-performance computing (HPC) clusters. However, standard monitoring tools rarely provide a unified, real-time view across all these environments. This lack of observability can lead to missed bottlenecks, harder debugging, and challenges in reproducing results.
What is ESRO?
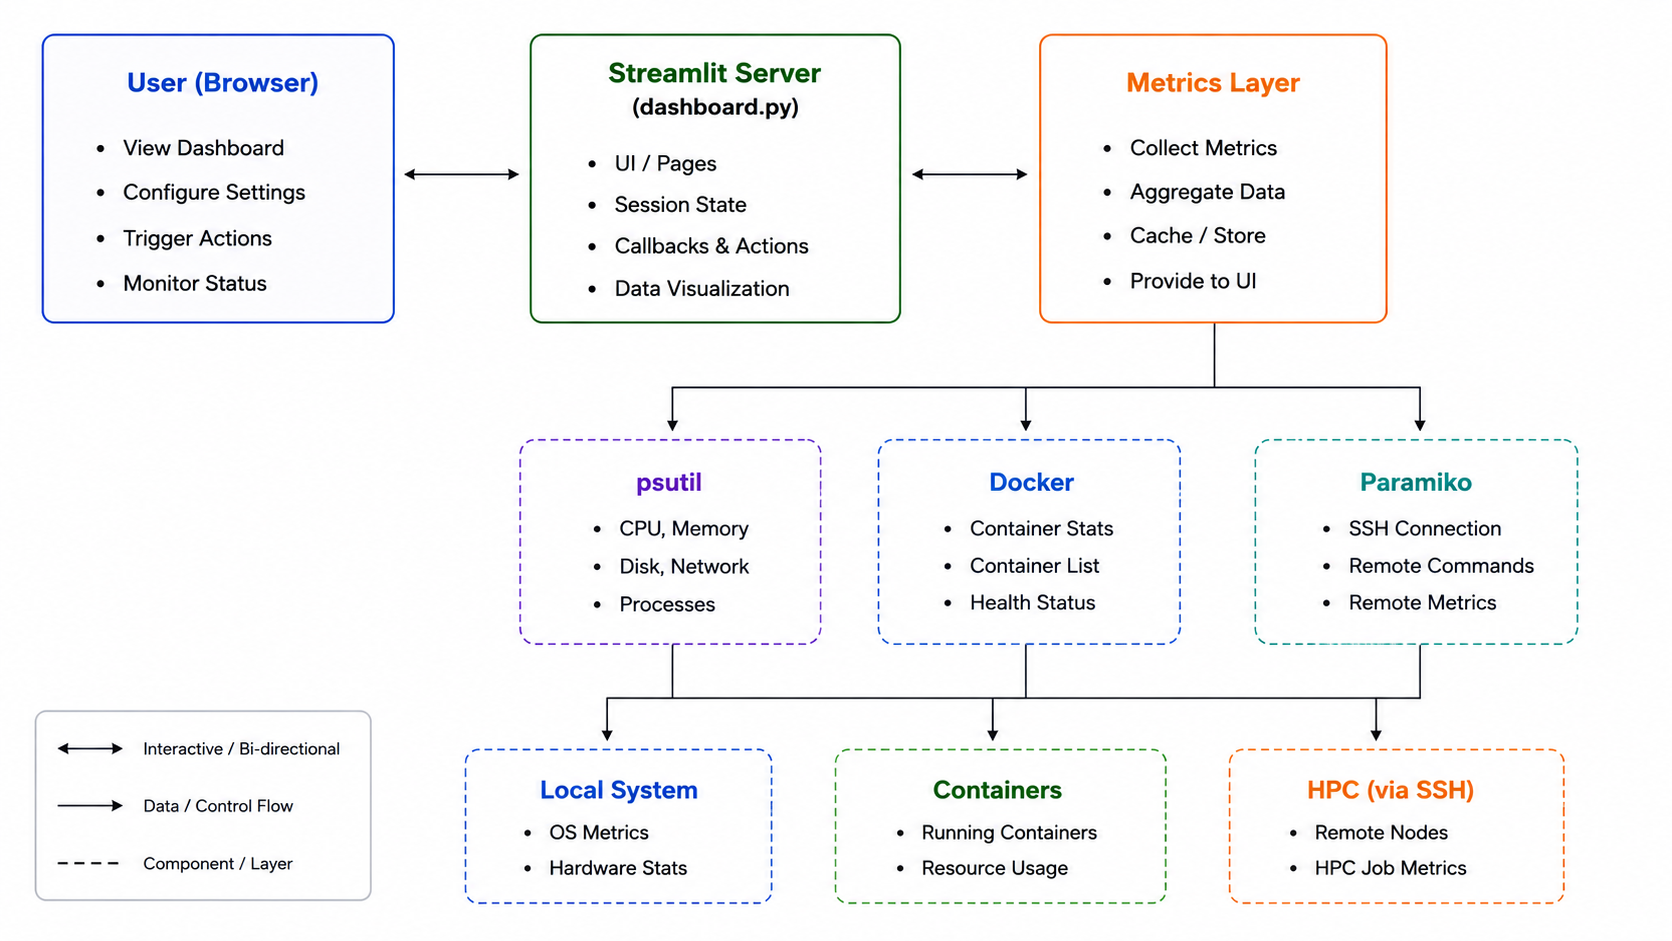
Energy Systems Runtime Observatory (ESRO) is an open source platform for unified, real-time monitoring of scientific workflows. ESRO brings together metrics from local systems, Docker containers, and remote HPC jobs, providing a single dashboard for resource usage, process health, and system metrics.
- Unified Monitoring: Real-time metrics from local, container, and HPC jobs.
- Lightweight & Extensible: Minimal overhead, easy deployment, and plugin support for new metrics or environments.
- Open Source: Built with Streamlit, psutil, and standard Python libraries for transparency and accessibility.
Quickstart
-
Clone the repository:
git clone https://github.com/Jayapreethi/energy-system-runtime-observatory.git -
Install dependencies:
pip install -r requirements.txt -
Run the dashboard using Streamlit:
streamlit run dashboard.py
Key Features
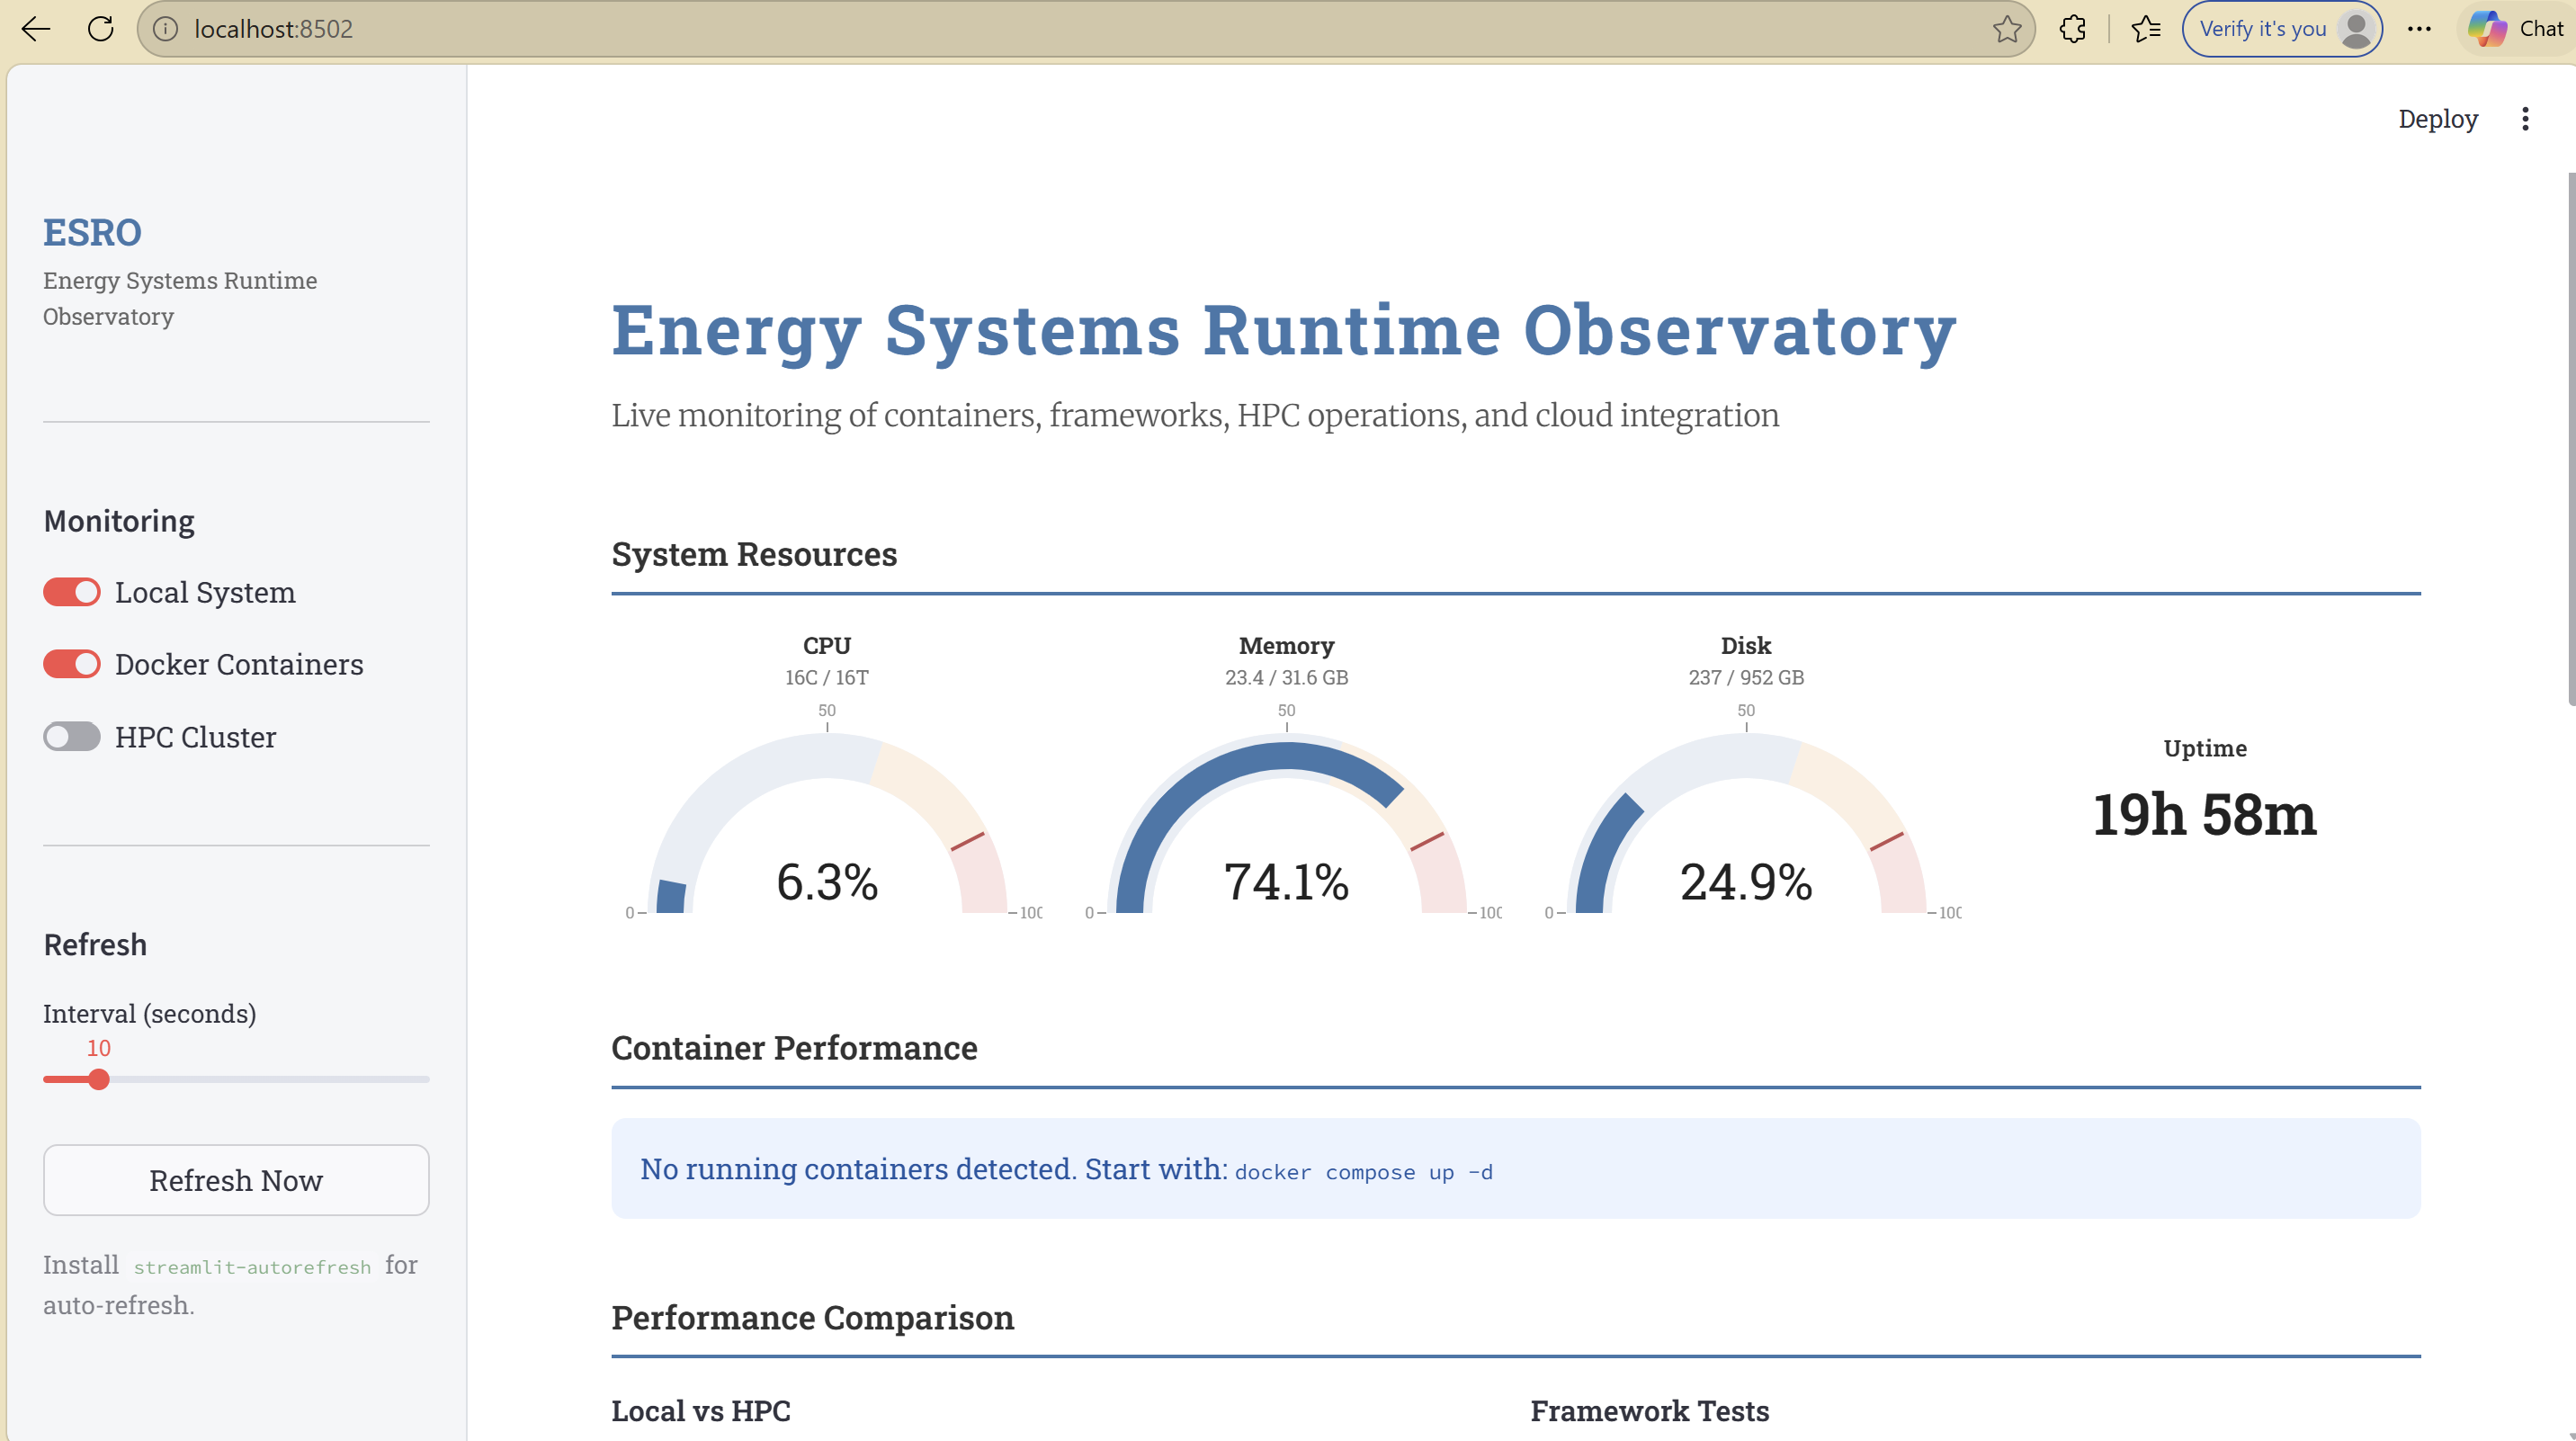
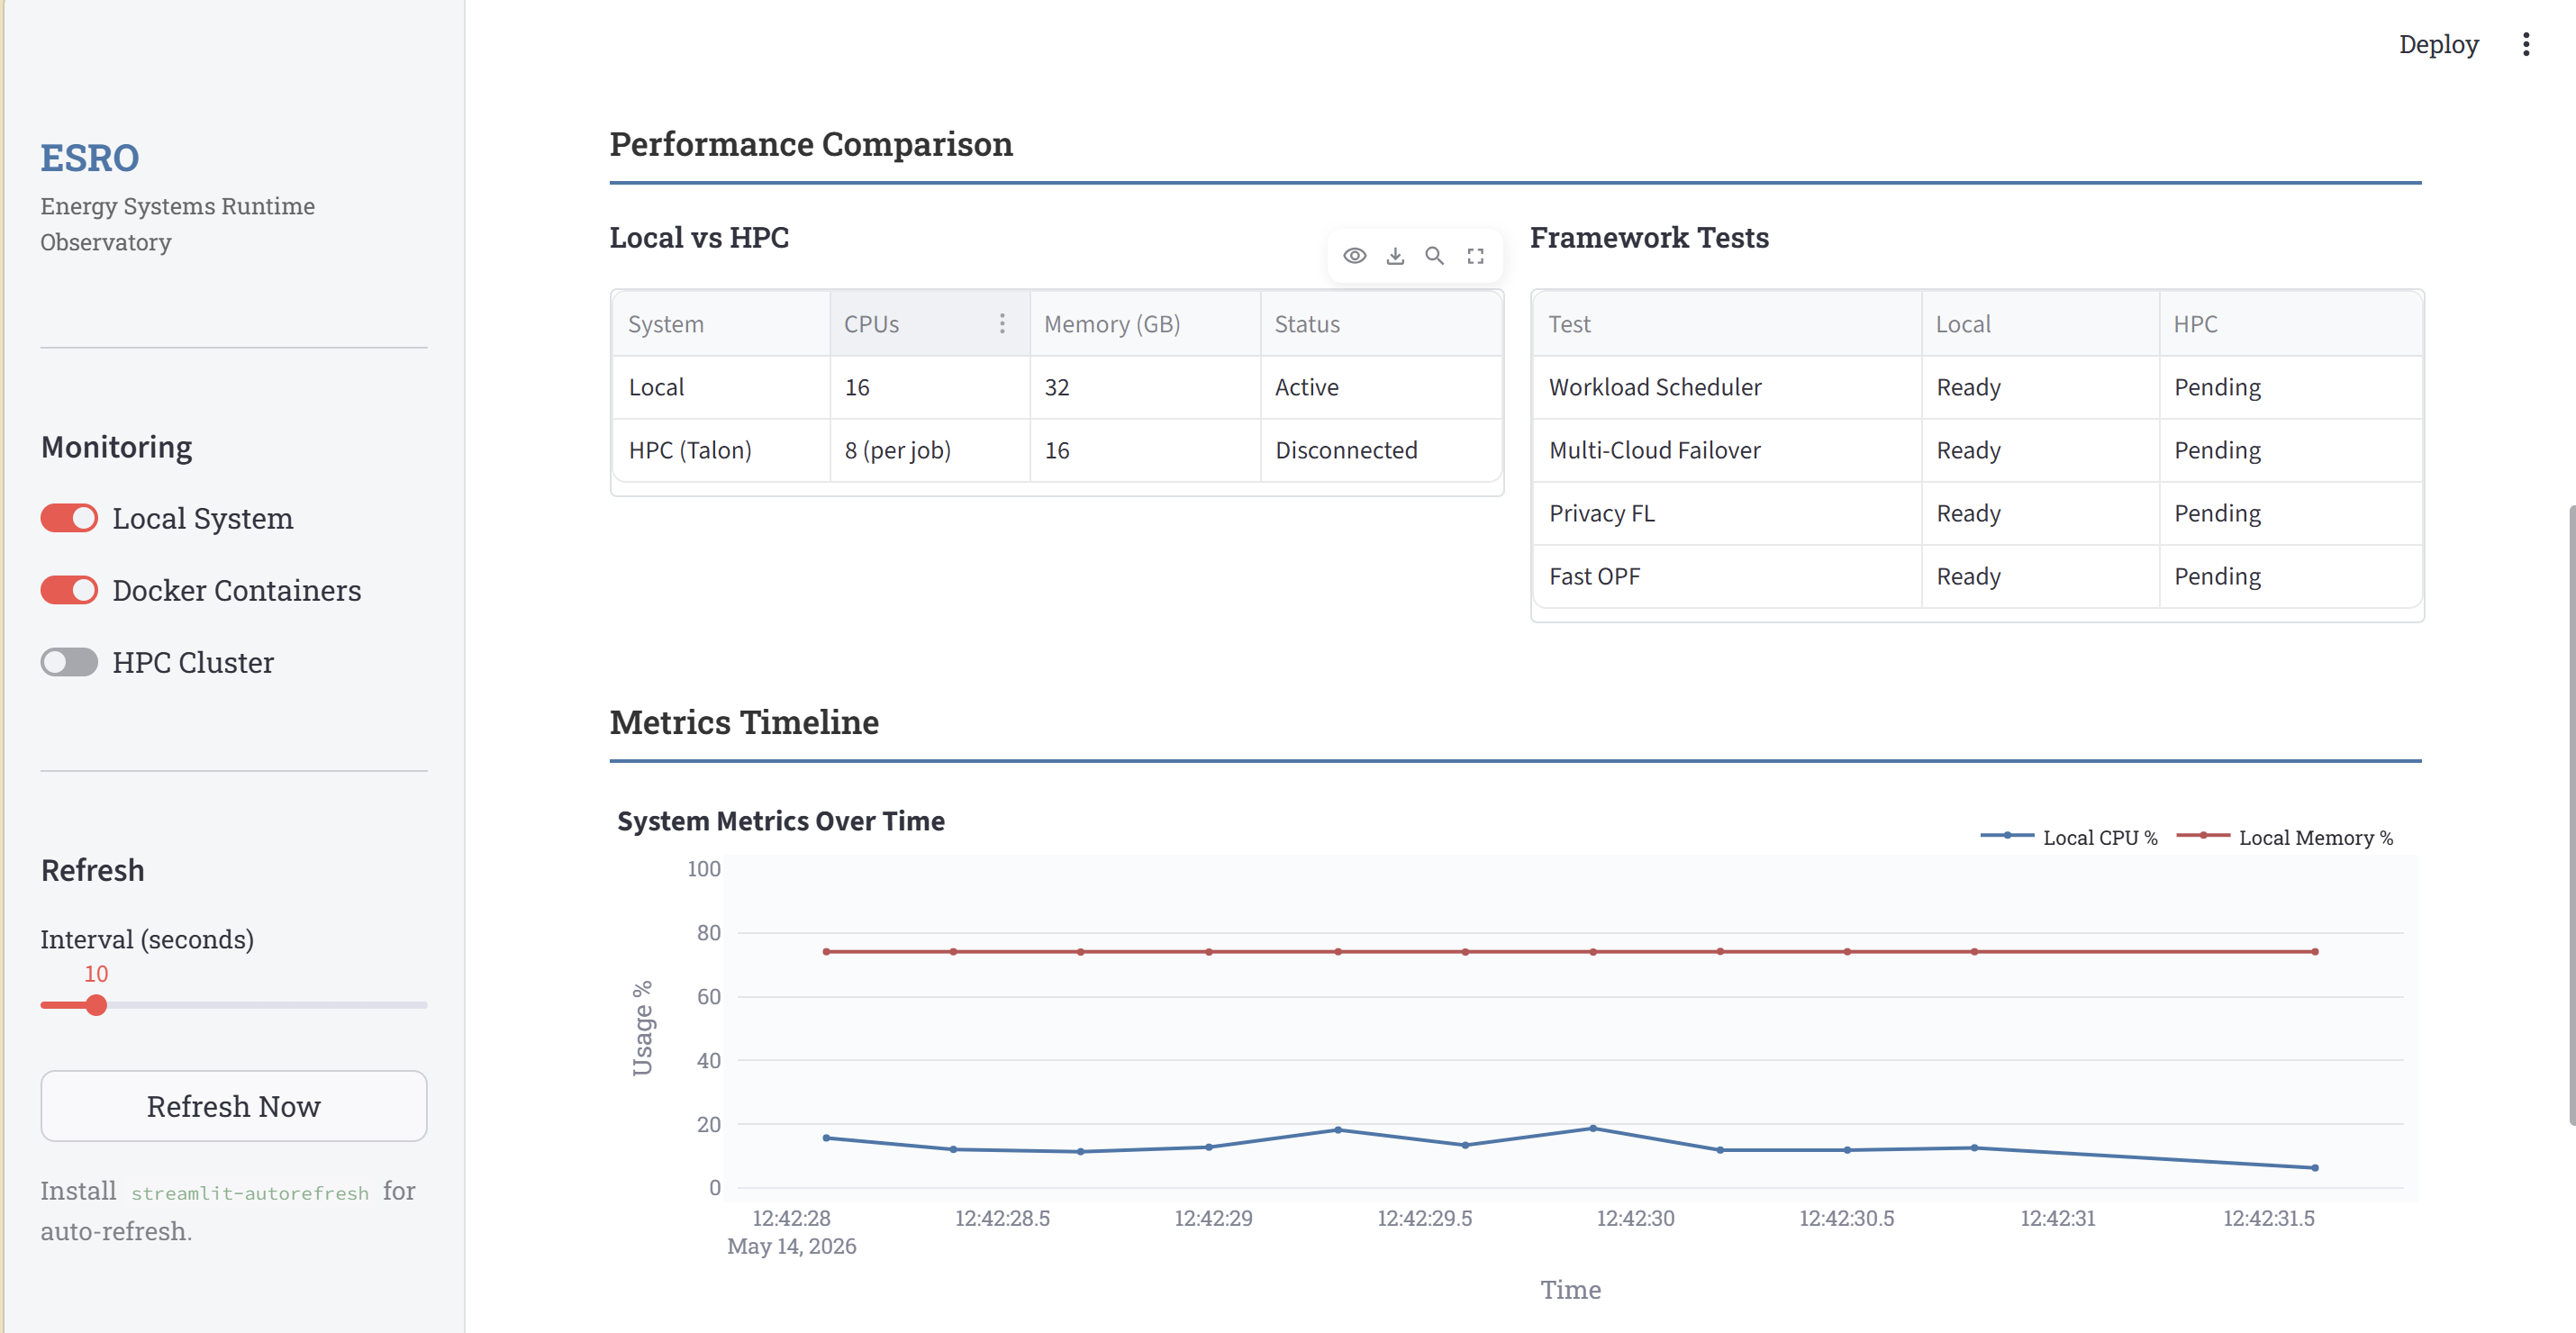
- Live dashboards for CPU, memory, GPU, and network usage.
- Process-level monitoring and anomaly detection.
- Support for Docker, SLURM, and custom HPC schedulers.
- Exportable logs for reproducibility and audit trails.
Usage
- Open the dashboard in your browser (Streamlit provides a local URL).
- Use the sidebar to enable local system monitoring or connect to an HPC cluster.
- For HPC jobs, enter your SSH credentials in the sidebar or use the example config below.
Example HPC Config
Reference JSON for HPC connection (see example_hpc_config.json):
{
  "host": "talon.und.edu",
  "username": "your_username",
  "password": "your_password"
}
Why ESRO Matters
- Improves experiment reproducibility and reliability by capturing full infrastructure context.
- Accelerates debugging and performance tuning with real-time, unified metrics.
- Enables sharing of infrastructure and runtime context for published results.